Gatling is a performance testing tool to carry out load tests on applications. Gatling can spawn thousands of virtual users/clients over a single machine as it is built on top of Akka and treats virtual users as messages and not threads. Thus having a lower footprint compared to other performance tools that use JVM threads.
As of version 3.7, Gatling now offers a Java and Kotlin DSL in addition to the existing Scala DSL. This makes adding the performance tests for an existing Java application even more straightforward. Before version 3.7, Scala was the main and only language to write performance tests with Gatling. While the required Scala knowledge to understand and adjust the tests can be learned quickly, especially with a JVM background, adding Scala tests to a Java-based projected required additional plugins and configuration (aka. complexity).
The upcoming article is an extracted section of the eBook 30 Testing Tools Every Java Developer Must Know aka. the Java Testing Toolbox. The goal of this eBook is to provide an overview of the Java testing ecosystem with cookbook-style introductions for the various testing libraries and tools. For demonstration purposes, we’re going to write a performance test for a sample REST API that allows clients to create and search for customer entities. Please note that we’re executing the test against a locally running backend and hence should be cautious with the test results. The preferred way would be to test our application in a production-like infrastructure setup.
Gatling Setup for Java Projects
There are multiple ways to write and run our performance tests with Gatling.
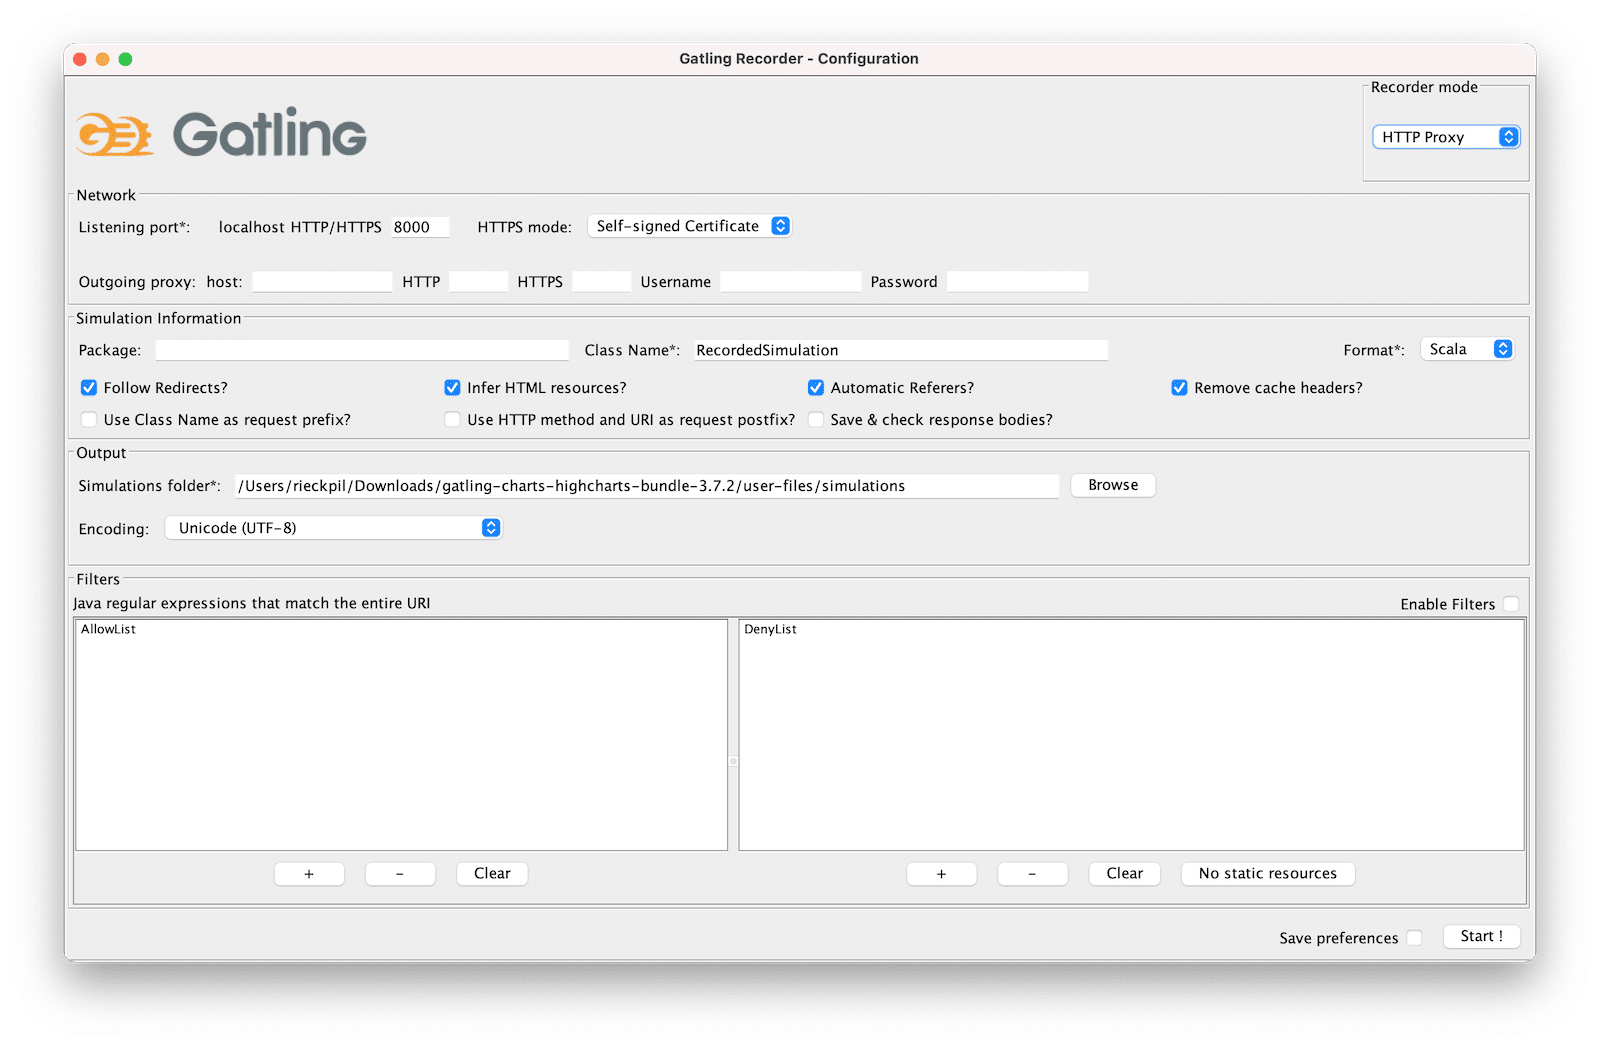
We can download a standalone bundle that ships with the Gatling Recorder as a first option. Using the Gatling Recorder, we launch a GUI to define our performance tests by intercepting and recording network calls:

After starting the recording and configuring our browser to use Gatling’s Recorder proxy, we perform the expected steps of the performance test within our browser.
Once recorded, the Recorder outputs the final performance test as a Java, Kotlin, or Scala file that we can run with a shell script. This works well for creating and running performance tests for web-based applications with multiple steps and getting to know the Gatling DSL.
Depending on how much experience we have with Gatling, we can either use the Recorder to define a blueprint of our performance test or write the test from scratch inside our IDE.
For the upcoming example, we’re going to develop the test from scratch and integrate it into our build process.
For Maven-based projects, we need the following dependency:
|
1 2 3 4 5 6 |
<dependency> <groupId>io.gatling.highcharts</groupId> <artifactId>gatling-charts-highcharts</artifactId> <version>3.7.2</version> <scope>test</scope> </dependency> |
In addition, we add the gatling-maven-plugin to our section of our pom.xml:
|
1 2 3 4 5 |
<plugin> <groupId>io.gatling</groupId> <artifactId>gatling-maven-plugin</artifactId> <version>4.0.2</version> </plugin> |
For Gradle-based projects, we add Gatling support with the following plugin:
|
1 2 3 |
plugins { id 'io.gatling.gradle' version '3.7.2' } |
The Gradle plugin then expects our Gatling performance tests as part of src/gatling/java folder.
We can further tweak our Gatling test setup with a user-defined gatling.conf file. By default, Gatling searches for this file within src/test/resources:
|
1 2 3 4 5 6 7 8 9 10 11 12 13 14 15 16 17 18 19 20 |
gatling { core { #outputDirectoryBaseName = "" # The prefix for each simulation result folder (then suffixed by the report generation timestamp) #encoding = "utf-8" # Encoding to use throughout Gatling for file and string } socket { #connectTimeout = 10000 # Timeout in millis for establishing a TCP socket # ... } ssl { keyStore { #file = "" # Location of SSLContext's KeyManagers store # ... } trustStore { #file = "" # Location of SSLContext's TrustManagers store # ... } } } |
As part of this file, we can configure global parameters for our performance tests like connection timeouts and SSL-specifics.
For more information on working with the standalone Gatling bundle to create performance tests with the Gatling Recorder (GUI), visit the Gatling homepage.
Gatling Terminology and Configuration
Before jumping right into the performance test, let’s start with the basic Gatling terminology.
When writing tests with Gatling and when consulting their documentation, we’ll get in contact with the following terms and concepts:
- Scenario: The summary of steps that the virtual users perform to simulate typical user behavior, e.g., log in to an application, create a new entity, search for this entity, delete the entity and then expect it’s no longer available in the search.
- Simulation: The definition of the load tests about how many virtual users will execute the Scenario in a given timeframe.
- Session: A state container assigned for each virtual user.
- Recorder: The Gatling UI to record a Scenario and output a Simulation.
- Feeders: A way to inject data for our virtual users from an external source like CSV files, JSON files, a JDBC data source, etc.
For our upcoming example, we’ll start with a simple Scenario. Our goal is to perform a stress test for one of the API endpoints of our Spring Boot application. We want to investigate and understand how our application performs when multiple users create new Customer entities in parallel. This includes sending multiple HTTP POST requests in parallel against /api/customers in a short period.
Alternatives to a stress test would be a capacity test or a soak test. With capacity tests, we gradually increase the user arrival rate to see where our max capacity is. On the other hand, with so-called soak tests, we’re running the performance test with the same user setup for a long timespan to identify leaks, for example.
Before defining the number of virtual users for our stress test, we have to understand whether we’re testing an open or closed system.
Open systems have no control over the number of concurrent users. Users and clients keep arriving regardless of the existing number of concurrent users inside the system. That’s the case for most websites and APIs.
On the contrary, closed systems have a maximum capacity of concurrent users inside the system. New users have to wait for an existing user to exit the system if the system is at max capacity. This is usually implemented with a feedback or queuing solution. Ticketing platforms typically operate this way, and new users are pushed into a queue when the system is at max capacity.
For our demo application, we’re working with an open system. There’s no limiting factor for the number of concurrent users on our side. With our stress test, we want to understand how a high user load impacts our API’s behavior and response times. If we’d be developing an e-commerce application, this test could be a preparation for an upcoming high traffic window like the weekend before Christmas.
Writing Java Performance Tests With Gatling
We’re going to write the Gatling performance test with the Java DSL. This way, we can easily integrate the test to our existing project and don’t have to configure our Maven project to compile Scala code additionally.
We can structure our Gatling performance test in three parts:
- The protocol configuration
- The Scenario definition
- The Simulation definition
Unlike tests that we run with the Maven Surefire or Failsafe plugin, no naming prefix like *Test is required for the Gatling performance test. We only have to extend the abstract Simulation class and add the test to our test directory src/test/java:
|
1 2 |
public class CustomerRequestSimulation extends Simulation { } |
Next, we define the protocol for this Simulation:
|
1 2 3 4 5 6 7 8 9 |
public class CustomerRequestSimulation extends Simulation { // Protocol Definition HttpProtocolBuilder httpProtocol = HttpDsl.http .baseUrl("http://localhost:8080") .acceptHeader("application/json") .userAgentHeader("Gatling/Performance Test"); } |
As we’re invoking our API over HTTP, we’re using Gatling’s HttpDsl for a shared base configuration of all upcoming HTTP requests.
What’s next is to define the Scenario. The Scenario represents the operations our virtual users perform throughout the performance test.
For our example, the Scenario consists of two HTTP requests: One HTTP POST request to create the entity and a second HTTP GET request to verify that we can query the new entity:
|
1 2 3 4 5 6 7 8 9 10 11 12 13 14 15 16 17 18 19 20 21 22 23 24 25 |
public class CustomerRequestSimulation extends Simulation { // ... Iterator<Map<String, Object>> feeder = Stream.generate((Supplier<Map<String, Object>>) () -> Collections.singletonMap("username", UUID.randomUUID().toString()) ).iterator(); // Scenario ScenarioBuilder scn = CoreDsl.scenario("Load Test Creating Customers") .feed(feeder) .exec(http("create-customer-request") .post("/api/customers") .header("Content-Type", "application/json") .body(StringBody("{ \"username\": \"${username}\" }")) .check(status().is(201)) .check(header("Location").saveAs("location")) ) .exec(http("get-customer-request") .get(session -> session.getString("location")) .check(status().is(200)) ); } |
We’re using an in-line Feeder to generate random usernames. As an alternative, we can also store a valid set of usernames within a CSV or JSON file.
Using the CoreDsl, we fluently build the Scenario. We start with instantiating a new ScenarioBuilder and pass a name for the entire Scenario. What’s next is to add the Feeder to use it as a data source for random data throughout our requests.
We’re chaining the different actions of our Scenario using exec. The first action (create-customer-request) is the HTTP POST request to create a customer entity. As we’ve already configured the base URL of our application as part of the protocol definition, we can use a relative path and add any remaining HTTP header. For our example, that’s the Content-Type header as we’re sending JSON data alongside the request.
Using the Gatling Expression Language, we can define a template of our JSON body and let Gatling inject the ${username} attribute using our Feeder. Furthermore, we verify the response code 201 (Created) and save the Location header inside the Session as this becomes important for the second request.
For the second action of our Scenario, we add an HTTP GET request to follow the Location header to verify the entity was stored successfully. What’s left is to verify that our API returns 200, indicating that the entity could be found (e.g., in a database) and returned to the client.
As the last step, we now have to define our Simulation. This is where we glue things together and configure the duration and load for the performance test:
|
1 2 3 4 5 6 7 8 9 10 |
public class CustomerRequestSimulation extends Simulation { // ... // Simulation public CustomerRequestSimulation() { this.setUp(scn.injectOpen(constantUsersPerSec(50).during(Duration.ofSeconds(15)))) .protocols(httpProtocol); } } |
Inside our constructor, we use the setUp method of the Simulation class we’re extending to set up the performance test. We refer to our Scenario (scn) and let 50 virtual users arrive every second for 15 seconds for a basic stress test. In total, that’s 1500 requests for our application within 15 seconds as each virtual user performs both an HTTP POST and GET request.
What’s left is to attach our HTTP protocol definition to make the Simulation complete.
For more advanced Simulation setups, head over to the Gatling documentation.
Running the Gatling Java Test and Analyzing the Result
With the Gatling Java performance test in place, now it’s time to run it and analyze the result.
For our stress test, we need a running backend locally. Adjusting the stress test to run against a deployed version of our application only requires changing the baseUrl of our HTTP protocol definition to something different from localhost.
After starting our backend, we can execute our performance test with the Gatling Maven Plugin:
|
1 |
mvn gatling:test |
The Gradle counterpart is gradle gatlingRun.
Depending on many HTTP requests are involved and if there’s a warmup time, running our Simulation can take some minutes.
Throughout the test execution, Gatling outputs the progress of the current Simulation to the console:
|
1 2 3 4 5 6 7 8 9 10 11 12 |
[INFO] --- gatling-maven-plugin:4.0.1:test (default-cli) @ spring-boot-example --- ================================================================================ 2021-12-07 06:48:16 5s elapsed ---- Requests ------------------------------------------------------------------ > Global (OK=500 KO=0 ) > create-customer-request (OK=250 KO=0 ) > get-customer-request (OK=250 KO=0 ) ---- Load Test Creating Customers ---------------------------------------------- [######################## ] 33% waiting: 500 / active: 0 / done: 250 ================================================================================ |
At the end of each Simulation, Gatling summaries the performance test. This summary includes statistical information for the response time (percentiles, averages, and mean) as well as information about the response codes:
|
1 2 3 4 5 6 7 8 9 10 11 12 13 14 15 16 17 18 19 20 21 22 23 24 25 26 27 28 29 30 31 32 33 34 |
2021-12-07 06:48:26 14s elapsed ---- Requests ------------------------------------------------------------------ > Global (OK=1500 KO=0 ) > create-customer-request (OK=750 KO=0 ) > get-customer-request (OK=750 KO=0 ) ---- Load Test Creating Customers ---------------------------------------------- [##########################################################################]100% waiting: 0 / active: 0 / done: 750 ================================================================================ Simulation de.rieckpil.blog.gatling.CustomerRequestSimulation completed in 15 seconds Parsing log file(s)... Parsing log file(s) done Generating reports... ================================================================================ ---- Global Information -------------------------------------------------------- > request count 1500 (OK=1500 KO=0 ) > min response time 0 (OK=0 KO=- ) > max response time 81 (OK=81 KO=- ) > mean response time 2 (OK=2 KO=- ) > std deviation 5 (OK=5 KO=- ) > response time 50th percentile 1 (OK=1 KO=- ) > response time 75th percentile 2 (OK=2 KO=- ) > response time 95th percentile 3 (OK=3 KO=- ) > response time 99th percentile 9 (OK=9 KO=- ) > mean requests/sec 100 (OK=100 KO=- ) ---- Response Time Distribution ------------------------------------------------ > t < 800 ms 1500 (100%) > 800 ms < t < 1200 ms 0 ( 0%) > t > 1200 ms 0 ( 0%) > failed 0 ( 0%) ================================================================================ |
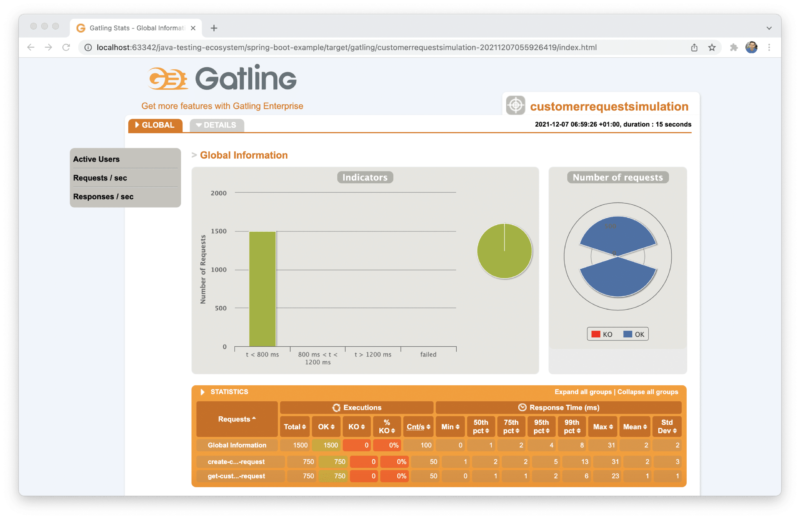
For our performance test example, we executed 1500 requests in total. Each Simulation contains two HTTP requests, one to create the customer (create-customer-request) and one to query for it (get-customer-request). None of the requests failed, and the response time for all requests was below 800ms.
From the global information section of the report, we can identify the max. response time of 81 ms for this test, while the mean response time was 2 ms. Keep in mind that this test was performed locally.
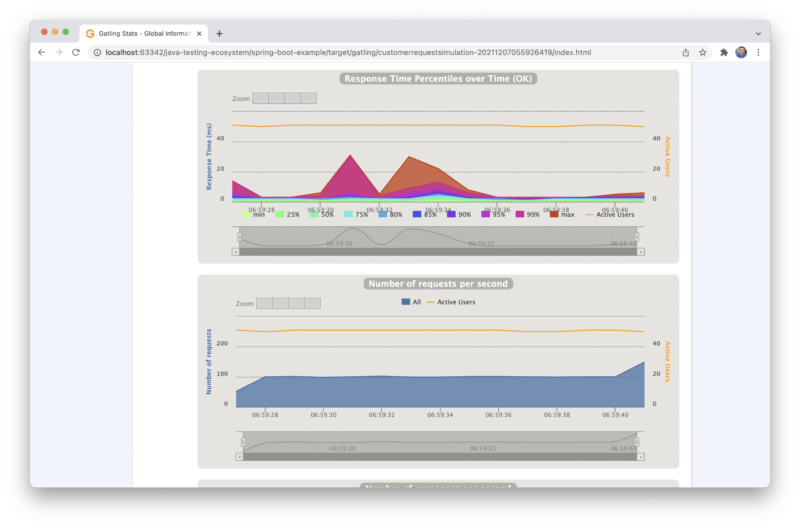
On top of the text-based result inside the console, Gatling creates an HTML-based report for further investigations. This visual test summary is stored within gatling folder inside the output directory of our build tool. For Maven, that’s target and Gradle build (unless we override these defaults).
We can open this report with any browser of our choice and further investigate the outcome:


The source code for this example is available on GitHub. As part of the spring-boot-example folder, you’ll find the sample application and the corresponding Java Gatling performance tests inside src/test/resources.
For similar cookbook-style introductions to various Java testing tools & libraries, grab your copy of the Java Testing Toolbox eBook.
Joyful testing,
Philip

