Tracing method calls in a monolith to identify slow parts is simple. Everything is happening in one application (context) and you can easily add metrics to gather information about e.g. the elapsed time for fetching data from the database. Once you have a microservice environment with service-to-service communication, tracing needs more effort. If a business operation requires your service to call other services (which might then also call others) to gather data, identifying the source of a bottleneck is hard. Over the past years, several vendors evolved to tackle this issue of distributed tracing (e.g. Jaeger, Zipkin etc.). As the different solutions did not rely on a single, standard mechanism for trace description and propagation, a vendor-neutral standard for distributed tracing was due: OpenTracing. With MicroProfile we get a dedicated specification to make use of this standard: MicroProfile OpenTracing.
Learn more about the MicroProfile OpenTracing specification, its annotations, and how to use it in this blog post.
Specification profile: MicroProfile OpenTracing
- Current version: 1.3
- GitHub repository
- Latest specification document
- Basic use case: Provide distributed tracing for your JAX-RS application using the OpenTracing standard
Basics about distributed tracing
Once the flow of a request touches multiple service boundaries, you need to somehow correlate each incoming call with the same business flow. To accomplish this with distributed tracing, each service is instrumented to log messages with a correlation id that may have been propagated from an upstream service. These messages are then collected in a storage system and aggregated as they share the same correlation id.
A so-called trace represents the full journey of a request containing multiple spans. A span contains a single operation within the request with both start and end-time information. The distributed tracing systems (e.g. Jaeger or Zipkin) then usually provide a visual timeline representation for a given trace with its spans.
Enabling distributed tracing with MicroProfile OpenTracing
The MicroProfile OpenTracing specification does not address the problem of defining, implementing or configuring the underlying distributed tracing system. It assumes an environment where all services use a common OpenTracing implementation.
The MicroProfile specification defines two operation modes:
- Without instrumentation of application code (distributed tracing is enabled for JAX-RS applications by default)
- With explicit code instrumentation (using the
@Tracedannotation)
So once a request arrives at a JAX-RS endpoint, the Tracer instance extracts the SpanContext (if given) from the inbound request and starts a new span. If there is no SpanContext yet, e.g. the request is coming from a frontend application, the MicroProfile application has to create one.
Every outgoing request (with either the JAX-RS Client or the MicroProfile Rest Client) then needs to contain the SpanContext and propagate it downstream. Tracing for the JAX-RS Client might need to be explicitly enabled (depending on the implementation), for the MicroProfile Rest Client it is globally enabled by default.
Besides the no instrumentation mode, you can add the @Traced annotation to a class or method to explicitly start a new span at the beginning of a method.
Sample application setup for MicroProfile OpenTracing
To provide you an example, I’m using the following two services to simulate a microservice architecture setup: book-store and book-store-client. Both are MicroProfile applications and have no further dependencies. The book-store-client has one public endpoint to retrieve books together with their price:
|
1 2 3 4 5 6 7 8 9 10 11 12 13 |
@Path("books") public class BookResource { @Inject private BookProvider bookProvider; @GET @Produces(MediaType.APPLICATION_JSON) public Response getBooks() { return Response.ok(bookProvider.getBooksFromBookStore()).build(); } } |
For gathering information about the book and its price, the book-store-client communicates with the book-store:
|
1 2 3 4 5 6 7 8 9 10 11 12 13 14 15 16 17 18 19 20 21 22 23 24 25 26 27 28 29 30 31 32 33 34 35 36 37 38 39 40 |
@RequestScoped public class BookProvider { @Inject private PriceCalculator priceCalculator; private WebTarget bookStoreTarget; @PostConstruct public void setup() { Client client = ClientBuilder .newBuilder() .connectTimeout(2, TimeUnit.SECONDS) .readTimeout(2, TimeUnit.SECONDS) .build(); this.bookStoreTarget = client.target("http://book-store:9080/resources/books"); } public JsonArray getBooksFromBookStore() { JsonArray books = this.bookStoreTarget .request() .get() .readEntity(JsonArray.class); List<JsonObject> result = new ArrayList(); for (JsonObject book : books.getValuesAs(JsonValue::asJsonObject)) { result.add(Json.createObjectBuilder() .add("title", book.getString("title")) .add("price", priceCalculator.getPriceForBook(book.getInt("id"))) .build()); } return result .stream() .collect(JsonCollectors.toJsonArray()); } } |
So there will be at least on outgoing call to fetch all available books and for each book and additional request to get the price of the book:
|
1 2 3 4 5 6 7 8 9 10 11 12 13 14 15 16 17 18 19 20 21 22 23 24 25 26 27 |
@RequestScoped public class PriceCalculator { private WebTarget bookStorePriceTarget; private Double discount = 1.5; @PostConstruct public void setUp() { Client client = ClientBuilder .newBuilder() .connectTimeout(2, TimeUnit.SECONDS) .readTimeout(2, TimeUnit.SECONDS) .build(); this.bookStorePriceTarget = client.target("http://book-store:9080/resources/prices"); } public Double getPriceForBook(int id) { Double bookPrice = this.bookStorePriceTarget .path(String.valueOf(id)) .request() .get() .readEntity(Double.class); return Math.round((bookPrice - discount) * 100.0) / 100.0; } } |
On the book-store side, when fetching the prices, there is a random Thread.sleep(), so we can later see different traces. Without further instrumentations on both sides, we are ready for distributed tracing. We could add additional @Traced annotations to the involved methods, to create a span for each method call and narrow down the tracing.
Using the Zipkin implementation on Open Liberty
For this example, I’m using Open Liberty to deploy both applications. With Open Liberty we have to add a feature for the OpenTracing implementation to the server and configure it in server.xml:
|
1 2 3 4 |
FROM open-liberty:kernel-java11 COPY --chown=1001:0 target/microprofile-open-tracing-server.war /config/dropins/ COPY --chown=1001:0 server.xml /config/ COPY --chown=1001:0 extension /opt/ol/wlp/usr/extension |
|
1 2 3 4 5 6 7 8 9 10 11 12 13 14 15 16 17 |
<?xml version="1.0" encoding="UTF-8"?> <server description="new server"> <featureManager> <feature>microProfile-3.0</feature> <feature>usr:opentracingZipkin-0.31</feature> </featureManager> <opentracingZipkin host="zipkin" port="9411"/> <mpMetrics authentication="false"/> <ssl id="defaultSSLConfig" keyStoreRef="defaultKeyStore" trustStoreRef="jdkTrustStore"/> <keyStore id="jdkTrustStore" location="${java.home}/lib/security/cacerts" password="changeit"/> <httpEndpoint id="defaultHttpEndpoint" httpPort="9080" httpsPort="9443" /> </server> |
The OpenTracing Zipkin implementation is provided by IBM and can be downloaded at the following tutorial.
For the book-store DNS resolution, you saw in the previous code snippets and to start Zipkin as the distributed tracing system, I’m using docker-compose:
|
1 2 3 4 5 6 7 8 9 10 11 12 13 14 15 16 17 18 |
version: '3.6' services: book-store-client: build: book-store-client/ ports: - "9080:9080" - "9443:9443" links: - zipkin - book-store book-store: build: book-store/ links: - zipkin zipkin: image: openzipkin/zipkin ports: - "9411:9411" |
Once both services and Zipkin is running, you can visit http://localhost:9080/resources/books to fetch all available books from the book-store-client application. You can now hit this endpoint several times and then switch to http://localhost:9411/zipkin/ and query for all available traces:
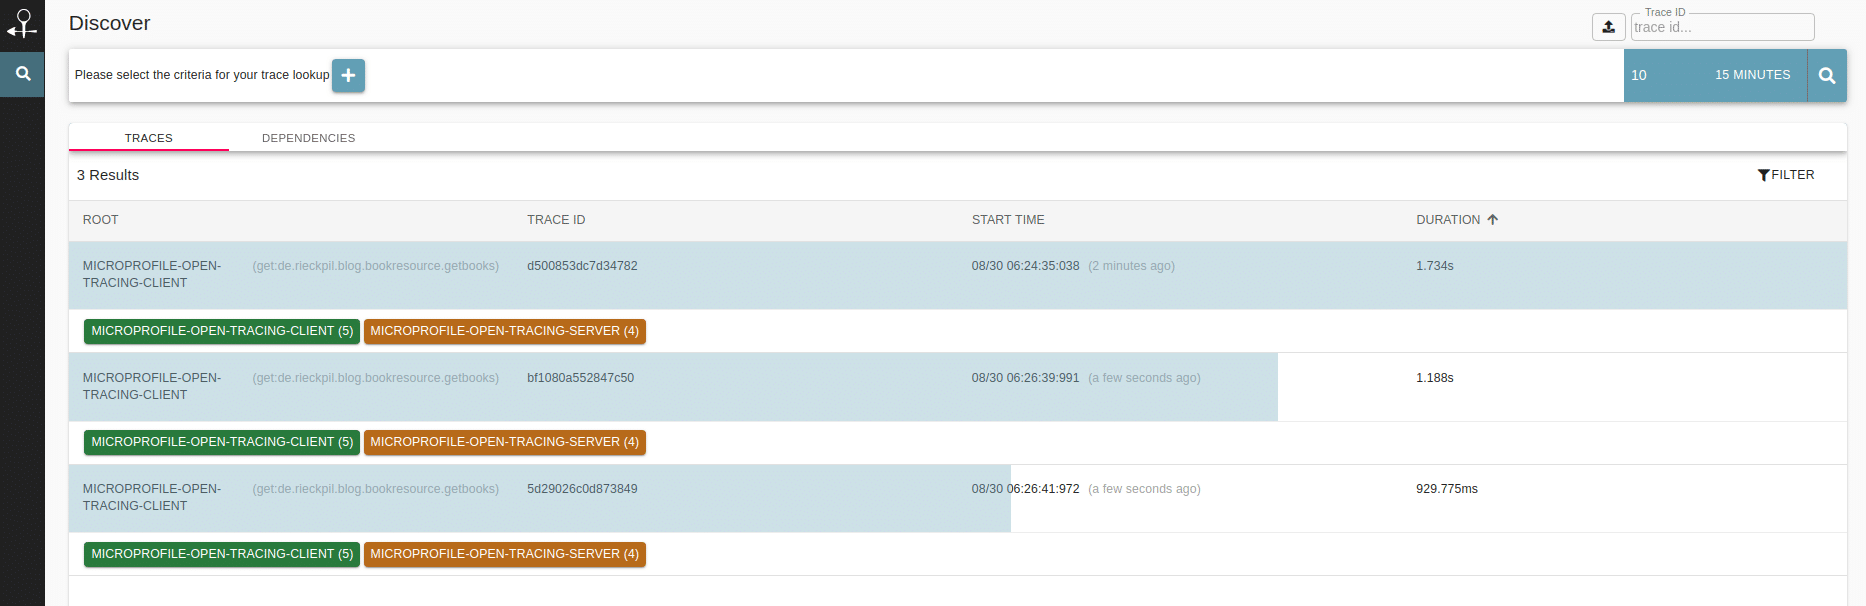
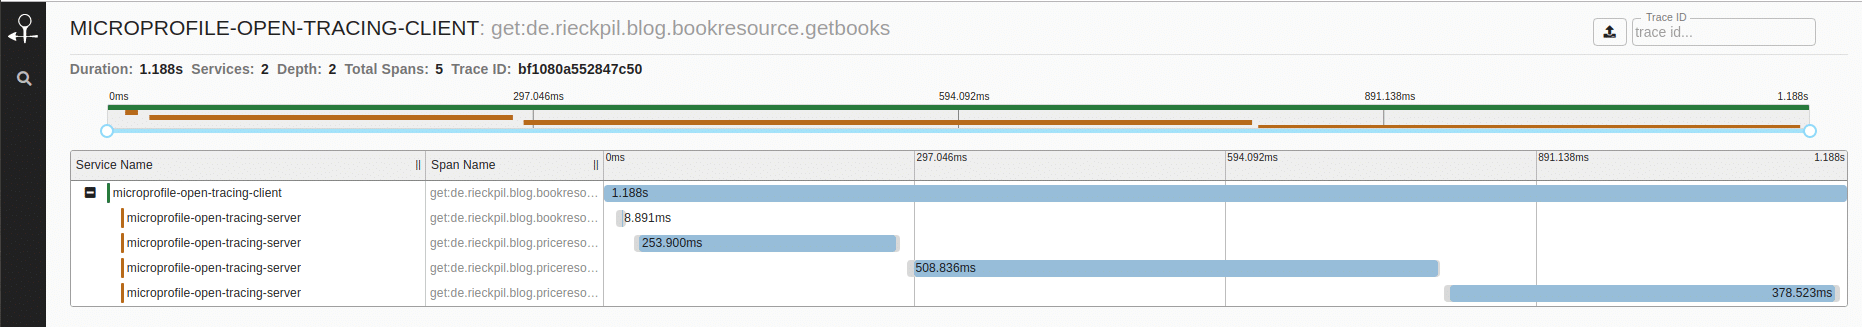
Once you click on a specific trace, you’ll get a timeline to see what operation took the most time:
YouTube video for using MicroProfile Open Tracing
Watch the following YouTube video of my Getting started with MicroProfile series to see MicroProfile OpenTracing in action:
You can find the source code with further instructions to run this example on GitHub.
Have fun using MicroProfile OpenTracing,
Phil
