Waiting for slow test suites to complete has become one of the most frustrating experiences in modern Spring Boot development. When our tests take 15+ minutes to run or fail unpredictably, we face a productivity crisis that affects the entire development cycle. Developers start skipping local test runs to avoid the wait, leading to more bugs reaching production and breaking the continuous feedback loop that makes agile development effective.
The hidden culprit behind most Spring Boot test performance issues lies in how we configure our test contexts. Spring’s TestContext caching mechanism, a powerful feature designed to accelerate test execution, often becomes misused and results in the opposite effect. Understanding and optimizing this mechanism can dramatically reduce build times, sometimes achieving 50-80% faster execution.
The Hidden Cost of Slow Spring Boot Tests
Slow tests create a cascade of problems that extend far beyond mere inconvenience.
When our test suite becomes a bottleneck, developers naturally adapt their workflow to avoid the pain. We see teams implementing workarounds like running only specific test classes, skipping integration tests during development, or worse, committing code without running tests locally.
Consider this typical scenario from a real Spring Boot project:
|
1 2 3 4 5 6 7 8 9 10 11 12 13 14 15 16 17 |
$ ./mvnw verify [INFO] ------------------------------------------------------- [INFO] T E S T S [INFO] ------------------------------------------------------- [INFO] Running com.example.UserServiceTest [INFO] Tests run: 15, Failures: 0, Errors: 0, Skipped: 0, Time elapsed: 8.429 s [INFO] Running com.example.PaymentControllerTest [INFO] Tests run: 8, Failures: 0, Errors: 0, Skipped: 0, Time elapsed: 5.234 s [INFO] Running com.example.OrderProcessingTest [INFO] Tests run: 12, Failures: 0, Errors: 0, Skipped: 0, Time elapsed: 7.891 s [INFO] Running com.example.DatabaseIntegrationTest [INFO] Tests run: 6, Failures: 0, Errors: 0, Skipped: 0, Time elapsed: 12.567 s [INFO] [INFO] ------------------------------------------------------------------------ [INFO] BUILD SUCCESS [INFO] ------------------------------------------------------------------------ [INFO] Total time: 18:23 min |
These execution times might seem reasonable for individual test classes, but the cumulative impact creates a significant barrier to productive development.
Each context reload adds unnecessary overhead, and without visibility into what’s happening under the hood, we cannot identify optimization opportunities.
The root cause typically comes from inconsistent test configurations across our test suite. When tests require slightly different Spring contexts, the framework cannot reuse existing contexts and must create new ones for each test class. This context recreation process involves component scanning, bean instantiation, dependency injection, and potentially database initialization – operations that consume substantial time and resources.
Understanding Spring TestContext Caching
Spring’s TestContext framework includes a caching mechanism designed to improve test performance by reusing application contexts across multiple test classes. When two tests share identical context configurations, Spring can reuse the same ApplicationContext instance, avoiding the expensive context creation process.
The caching mechanism works by creating a unique key for each context configuration. This key includes factors such as:
- Configuration classess
- Active Spring profiles
- Property sources and their values
- Context initializers
- etc.
When a test needs a context, Spring first checks if a compatible context already exists in the cache.
If found, that context is reused.
If not, a new context is created and cached for future use.
Let’s examine how different test configurations affect context caching:
|
1 2 3 4 5 6 7 8 9 10 11 12 13 14 15 16 17 18 19 20 21 22 23 24 25 26 27 |
@SpringBootTest @TestPropertySource(properties = "logging.level.com.example=DEBUG") class UserServiceIT { @Autowired private UserService userService; @Test void testCreateUser() { assertThat(user.getUsername()).isEqualTo("john.doe"); } } @SpringBootTest @TestPropertySource(properties = "logging.level.com.example=INFO") class PaymentServiceIT { @Autowired private PaymentService paymentService; @Test void testProcessPayment() { PaymentResult result = paymentService.processPayment(new BigDecimal("100.00")); assertThat(result.isSuccessful()).isTrue(); } } |
These two test classes appear similar, but they require different Spring contexts due to the different logging level properties.
Spring must create separate contexts for each, missing the opportunity to reuse a cached context and significantly increasing test execution time.
The challenge becomes more complex in larger applications where we might have dozens of test classes with subtle configuration differences.
Without proper tooling, identifying these inefficiencies becomes nearly impossible, and developers unknowingly create performance bottlenecks with each new test they add.
Spring Test Profiler: Revealing Performance Bottlenecks
The Spring Test Profiler addresses the visibility gap in Spring Boot test performance by providing detailed insights into context caching behavior and test execution patterns.
This open-source tool analyzes our test runs and generates comprehensive reports that identify optimization opportunities.
The profiler works by integrating with Spring’s test execution lifecycle, capturing detailed metrics about context creation, reuse, and overall test performance.
It tracks which tests share contexts, which tests force expensive context reloads, and where we can consolidate configurations for better cache efficiency.
Installation and Setup
Integrating the Spring Test Profiler into our project requires minimal configuration.
We add the dependency to our Maven build file:
|
1 2 3 4 5 6 7 |
<dependency> <groupId>digital.pragmatech.testing</groupId> <artifactId>spring-test-profiler</artifactId> <!-- check latest version --> <version>0.0.11</version> <scope>test</scope> </dependency> |
Next, we activate the profiler by adding a META-INF/spring.factories file to our test resources directory:
|
1 2 3 4 |
org.springframework.test.context.TestExecutionListener=\ digital.pragmatech.testing.SpringTestProfilerListener org.springframework.context.ApplicationContextInitializer=\ digital.pragmatech.testing.diagnostic.ContextDiagnosticApplicationInitializer |
This configuration registers the profiler’s listeners with Spring’s testing framework, enabling it to monitor test execution without requiring changes to our existing test classes.
What’s left is to run the tests with, e.g. ./mvnw verify.
The profiler works with Maven and Gradle, Java 17+ and Spring Framework 6.x (Spring Boot 3.x), making it compatible with modern Spring Boot applications.
Once configured, it automatically begins collecting performance data during test runs.
Analyzing Test Performance Data
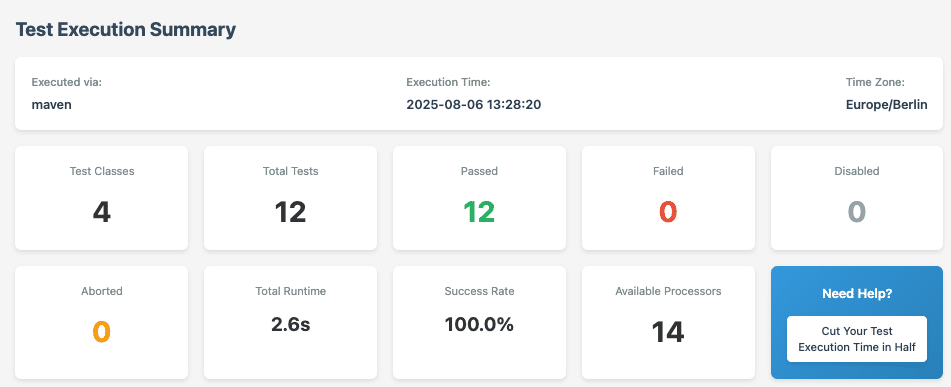
After running our test suite with the profiler enabled, we receive detailed reports within target/spring-test-profiler (build/spring-test-profiler for Gradle projects, respectively) that reveal the hidden performance characteristics of our tests.
The profiler generates both console output and comprehensive HTML reports that provide actionable insights.
The reports identify several key performance indicators:
- Context Reload Analysis shows which tests force expensive Spring context recreations and explains why context reuse failed. This information helps us understand the specific configuration differences that prevent context sharing.
- Cache Optimization Recommendations provide specific suggestions for improving context reuse across our test suite. These recommendations often focus on standardizing test configurations and identifying unnecessary configuration variations.
- Performance Bottlenecks highlight the slowest tests and quantify the impact of context loading overhead. This data helps us prioritize optimization efforts where they’ll have the greatest impact.
The profiler also tracks resource usage patterns, showing memory consumption and timing metrics that help us understand the true cost of our test configurations.
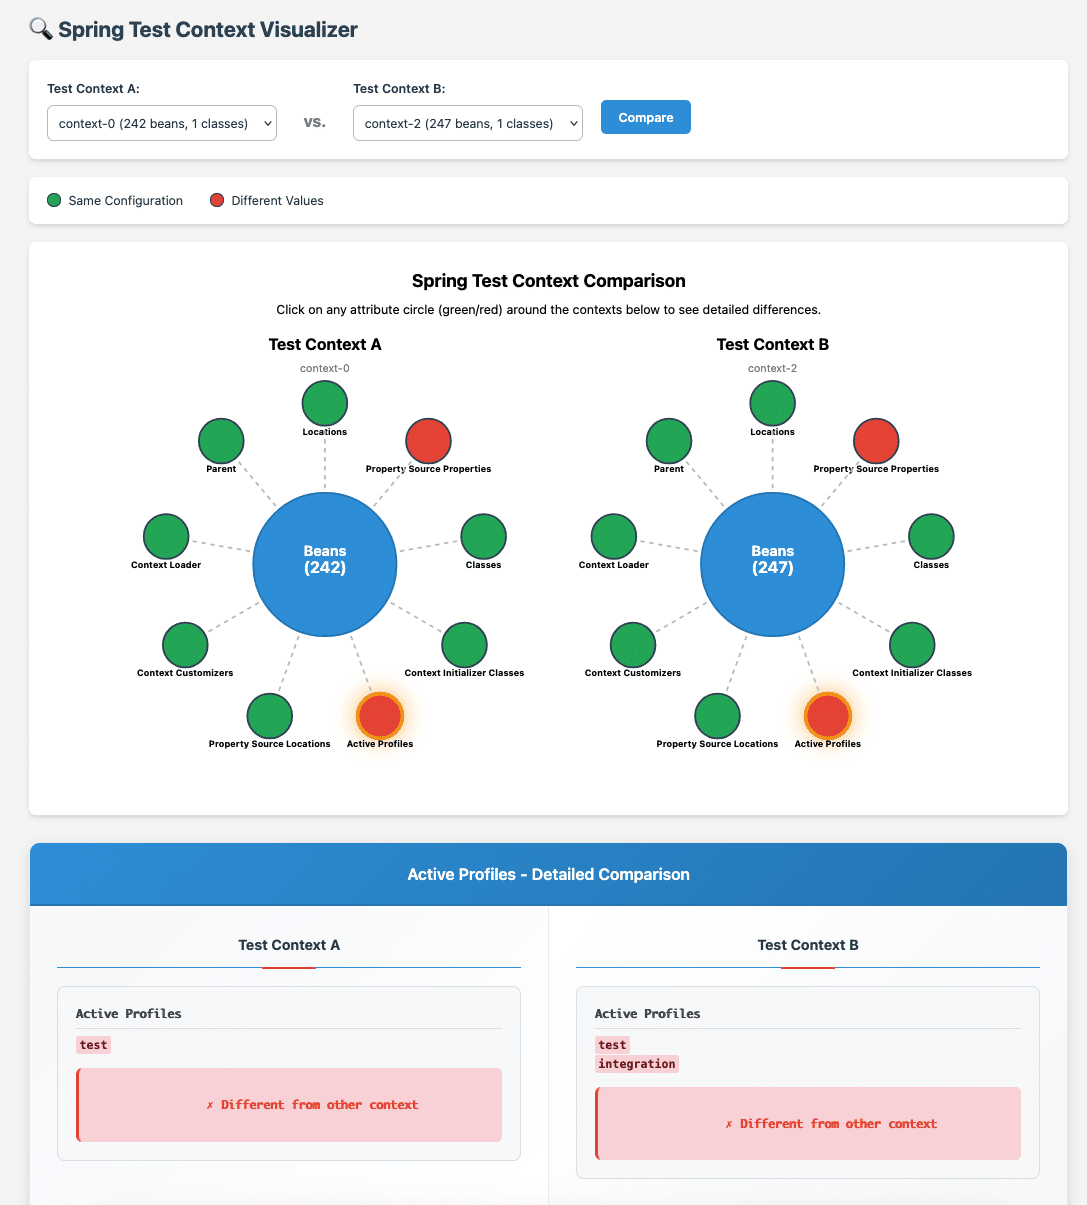
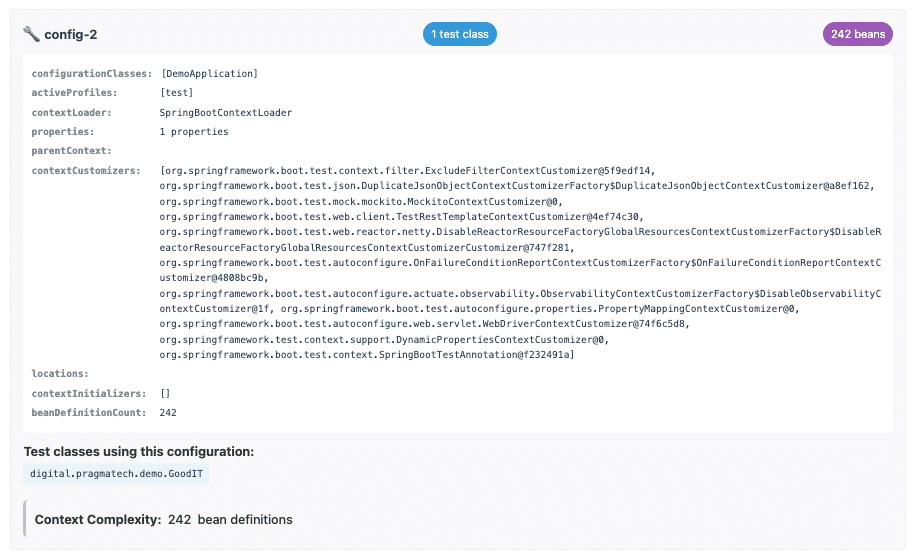
We can also compare two test context side-by-side to understand their differences:
What’s also planned is to include static analysis on the test setup to provide hints that hinder the caching mechanism to function properly.
This includes warnings when using @DirtiesContext throughout the tests:
Summary of the Spring Test Profiler
The Spring Test Profiler transforms test performance optimization from guesswork into a data-driven process. By providing detailed visibility into Spring TestContext caching behavior, it enables us to identify and eliminate the configuration inconsistencies that cause expensive context reloads.
By incorporating the Spring Test Profiler into our development workflow, we can maintain fast feedback loops, encourage comprehensive testing practices, and ultimately deliver higher-quality software. The time investment required for setup and optimization pays dividends through improved developer productivity and more reliable continuous integration processes.
Fast tests enable fast development.
With the right tools and understanding of Spring’s TestContext caching mechanisms, we can ensure our test suites remain an asset rather than an impediment to productive Spring Boot development.
Start using the Spring Test Profiler now.
Joyful testing,
Philip


