Local development on your machine is easy. But once you deploy your application you have a quite different environment. This might lead to unexpected behavior or errors. Manually applying System.out.println("Now we are here and variable X is = " + x); to your application’s code is quite cumbersome and takes a lot of time. Luckily with Java, we have a mature debugging ecosystem. This enables us to remote debug Spring Boot applications and analyze its workflow on a remote server/cloud.
To show you how simple remote debugging with Java really is, I’ll use a Spring Boot 2.3 application running on Java 11. I’ll deploy the app both as a Docker container and with the old-school java -jar ... way. Finally, you’ll learn how to remotely debug the REST interface with IntelliJ IDEA (2019.1) and Eclipse (2019-03).
Project setup
For the application, I’ve chosen a simple Spring Boot 2.3 application. It includes an embedded H2 database and JPA to serve books, which are randomly generated on startup.
The controller class, I’ll later use for debugging, looks like the following:
|
1 2 3 4 5 6 7 8 9 10 11 12 13 14 15 16 17 18 19 20 21 22 23 24 25 26 27 |
@Slf4j @RestController @RequestMapping("/api/books") public class BookController { @Autowired private BookRepository bookRepository; @GetMapping public List<Book> getAllBooks() { log.info("Retrieving all available books"); List<Book> allAvailableBooks = bookRepository.findAll(); return allAvailableBooks; } @GetMapping("/{id}") public Book getBookById(@PathVariable("id") Long id) { log.info("Retrieving book with id: {}", id); Optional<Book> book = bookRepository.findById(id); if (book.isEmpty()) { throw new BookNotFoundException("Can't find book with id: " + id); } return book.get(); } } |
The rest of the application is omitted but you can find the whole source code on GitHub.
Deployment
To be able to remote debug your Spring Boot Java-based application, we have to pass the following arguments to the JVM:
|
1 |
-agentlib:jdwp=transport=dt_socket,server=y,suspend=n,address=*:8000 |
The specified port in this argument is later used to attach our IDEs to the running JVM and should not be the same as the application’s port.
The argument can be passed to the JVM with the following command:
|
1 |
java -agentlib:jdwp=transport=dt_socket,server=y,suspend=n,address=*:8000 -jar target/remote-debugging-spring-boot-application.jar |
While using Docker, we can add this argument to our ENTRYPOINT and just need to map the additional port while starting the Docker container:
|
1 2 3 4 |
FROM openjdk:11-jdk-slim VOLUME /tmp COPY target/remote-debugging-spring-boot-application.jar app.jar ENTRYPOINT ["java","-agentlib:jdwp=transport=dt_socket,server=y,suspend=n,address=*:8000","-jar","/app.jar"] |
|
1 |
docker run -d -p 8080:8080 -p 8000:8000 --name debug-me debug-me |
Important: To be able to remote debug on a remote server in the next steps, make sure no firewall rule blocks this port and you are able to access it from your local machine.
Remote Debug Spring Boot applications with IntelliJ IDEA
Remote debugging the Spring Boot application with IntelliJ IDEA requires you to open the project (source code) with IntelliJ. We can then go to Edit configurations… on the top right next to green start button:
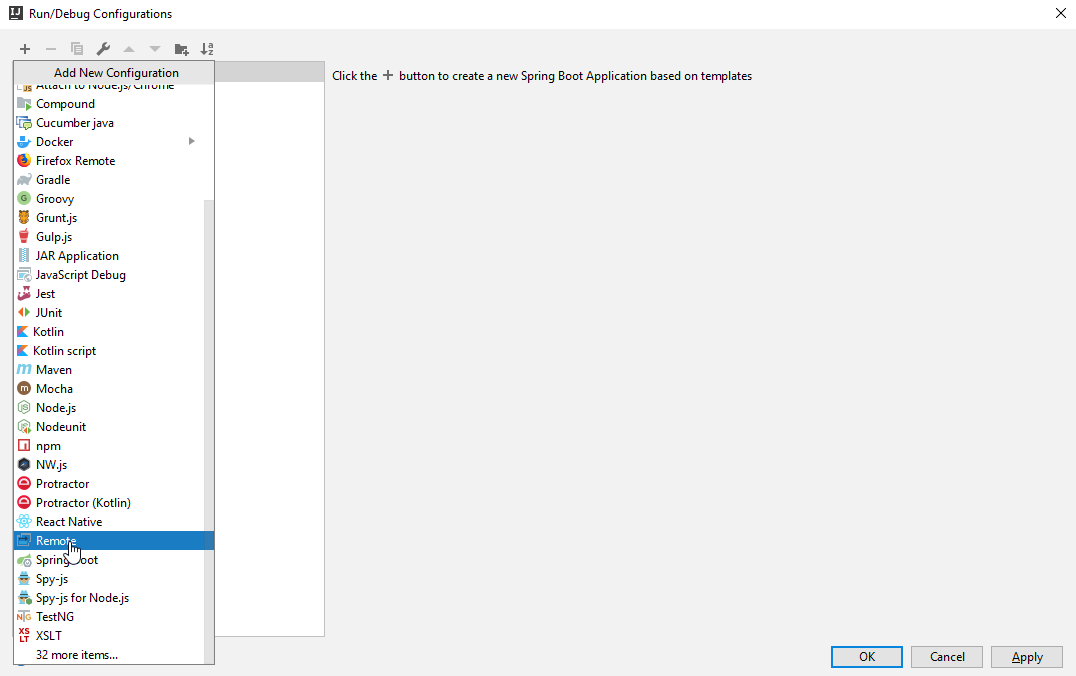
Choose to create a new Run/Debug configuration while clicking on the + button and select Remote. Older IntelliJ versions might have different wordings like Remote Debugging, Debugging, etc.:
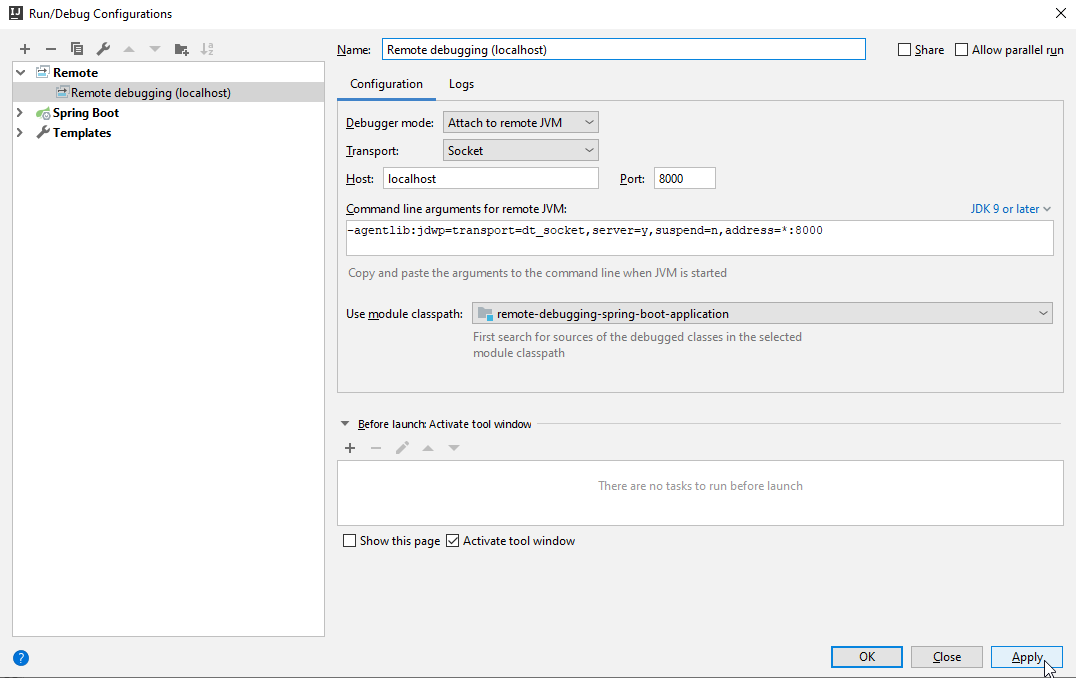
Next, enter a name for the Remote debug configuration of your choice and specify the port and host you want to connect to (in our example port 8000). Make sure to select the correct project for Use module classpath and click Apply or Ok:
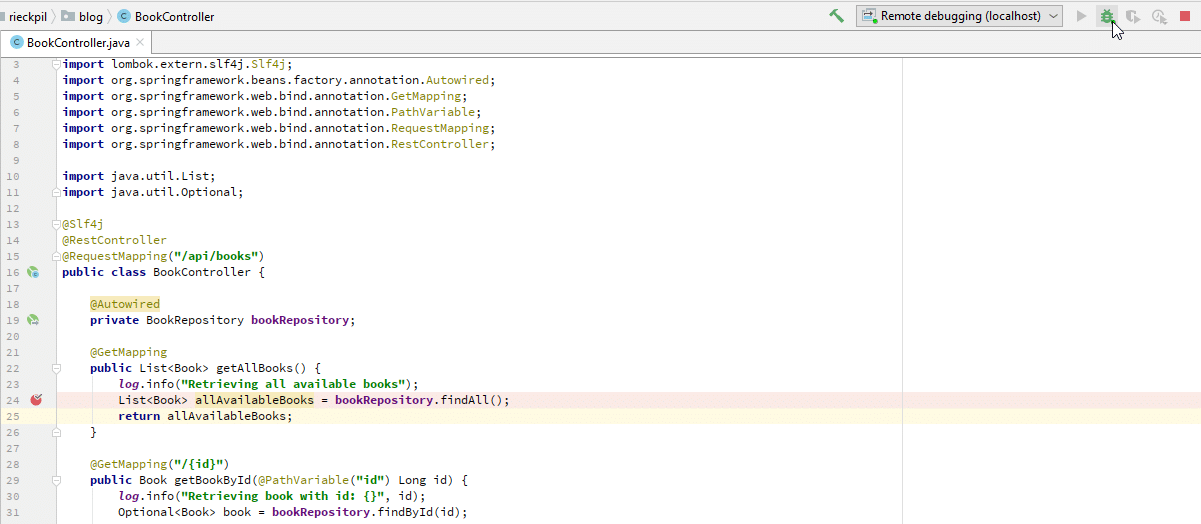
Now mark a line in your source code you want to debug and start the Remote debugging configuration (make sure your application is already running):
Now try to access the endpoint (http://localhost:8080/api/books in this example) with your browser or API client and you should be able to debug the specified part of your application within your IDEA:
To stop remote debugging the application, just press the red stopping button.
Remote Debug Spring Boot applications with Eclipse
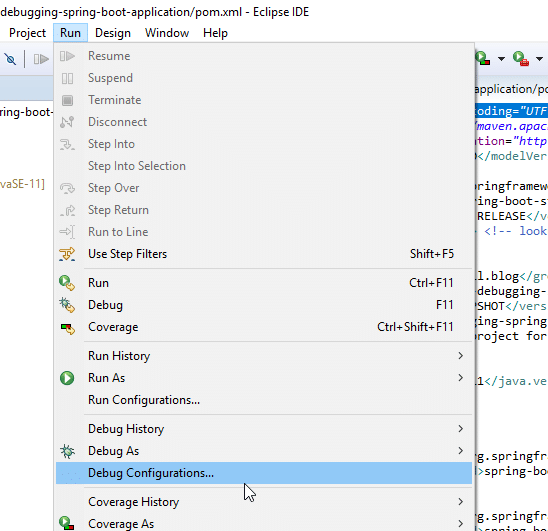
For Eclipse you also first have to import the project and can then go to Run -> Debug Configurations:
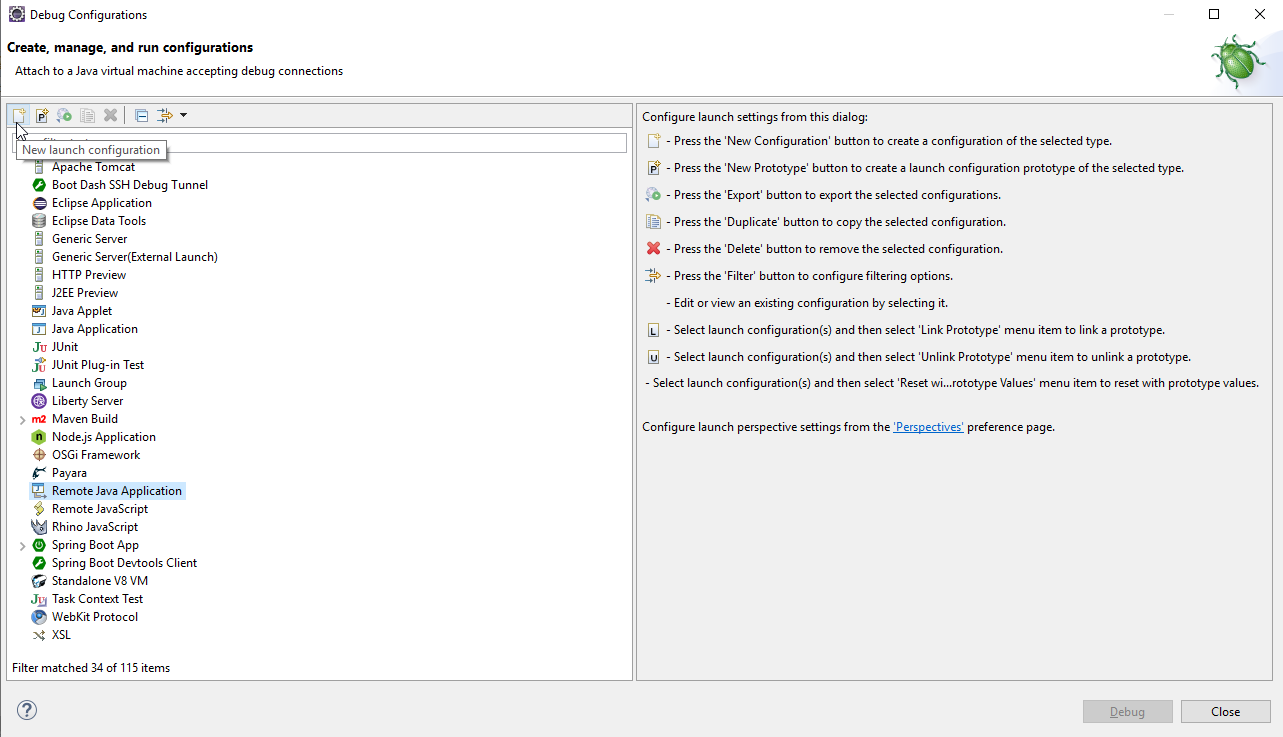
Select Remote Java Application (this might also have a different name in previous Eclipse versions) in the list. Next, click the New launch configuration icon on the top left of the window:
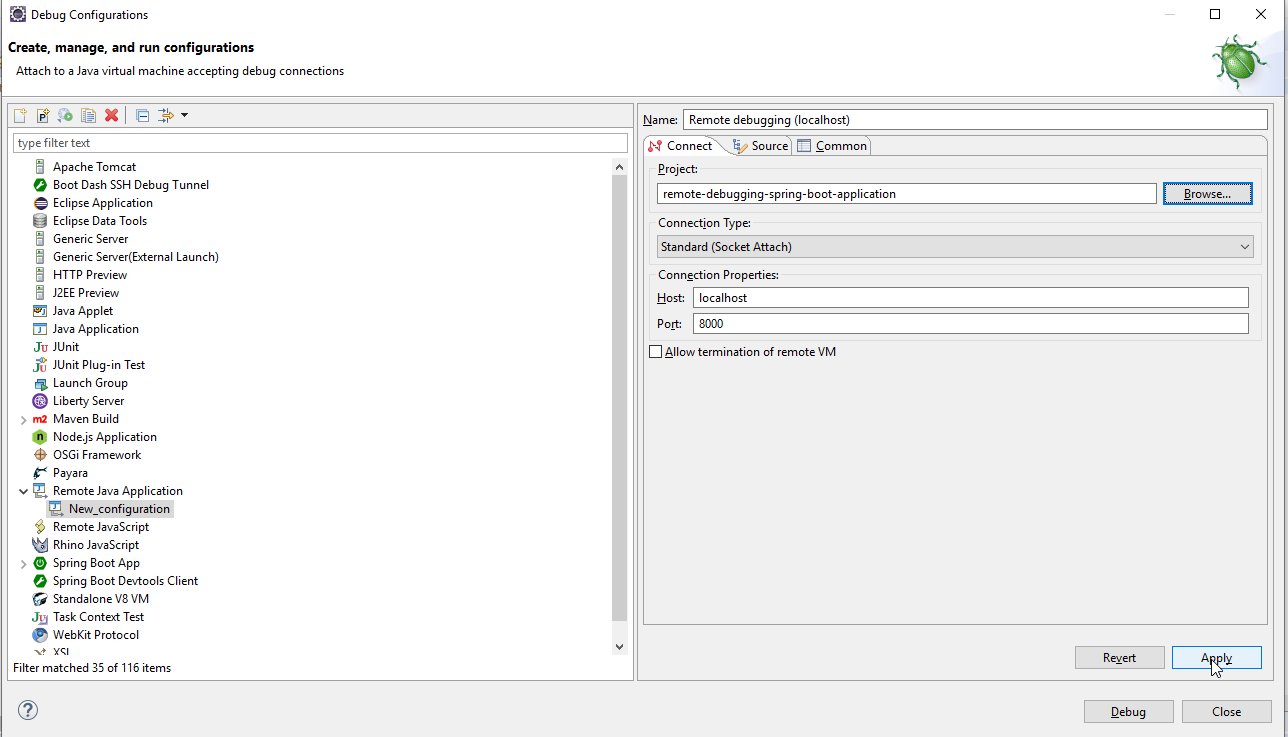
Here you can now enter the required remote debug configurations. Make sure to select the right project for remote debugging, the correct port and hostname. Click Apply to create this new debug configuration and then Debug to start debugging:
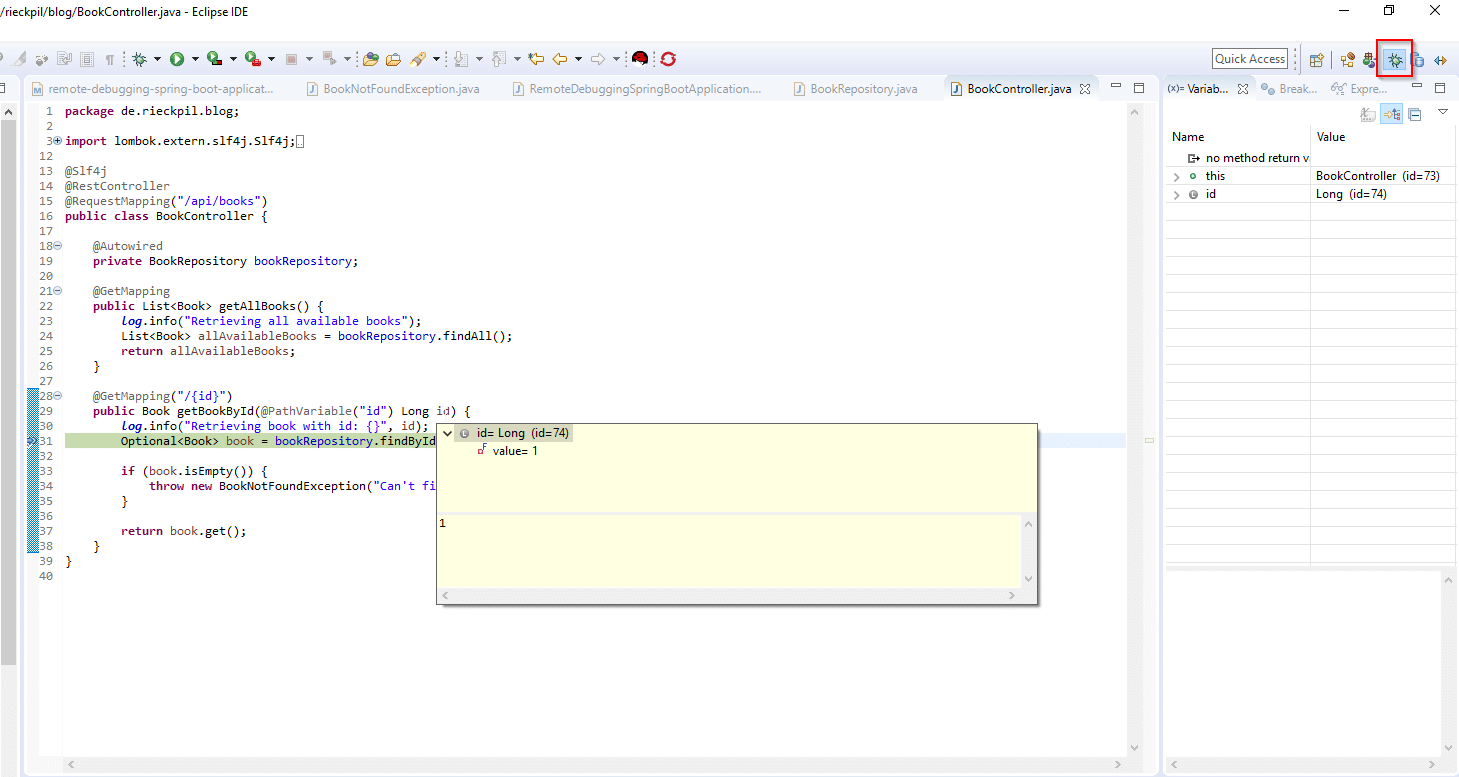
Now switch to the Debug perspective of Eclipse on the top right (if you can’t see this icon, go to Window -> Perspective -> Open Perspective -> Debug), make sure you have a breakpoint in place, hit the endpoint you want to debug and you should be able to debug your selected part of the application:
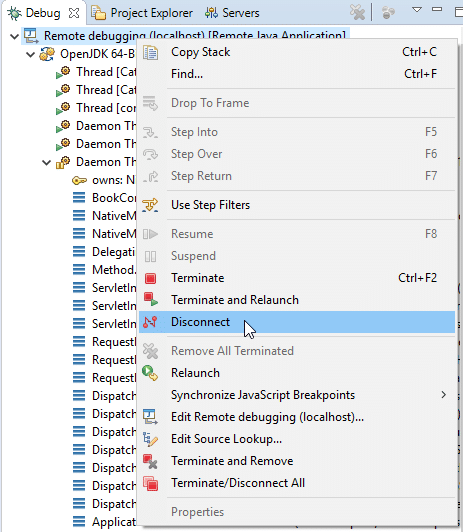
To stop remote debugging with Eclipse, right-click on the project on the left and select Disconnect:
Have fun remote debugging your Spring Boot application,
Phil


