Testing your application’s performance during development as a single user is easy but often misleading. With writing unit- and integration-tests you make sure your main use cases and algorithms work as expected and cover the requirements of the business. Testing the performance of your application under the expected load is often neglected and after deploying to production and serving hundreds/thousands of users concurrently serious performance issues get detected. To avoid this scenario I want to show you a simple way to load test your applications with Apache Benchmark.
Introduction to Apache Benchmark
Apache Benchmark (ab) is a CLI-tool which comes with the Apache HTTP server (HTTPD). To follow the example in the blog post, make sure you have installed the Apache HTTP Server on your machine and the ab binary is available on your PATH:
|
1 2 3 4 5 6 7 8 9 10 |
$ ab ab: wrong number of arguments Usage: ab [options] [http://]hostname[:port]/path Options are: -n requests Number of requests to perform -c concurrency Number of multiple requests to make at a time -t timelimit Seconds to max. to spend on benchmarking This implies -n 50000 -s timeout Seconds to max. wait for each response ... |
For testing purposes, I’ve created a simple Spring Boot based application with a REST interface which I want to test with Apache Benchmark. The setup is quite simple as I am using an H2 database to store a thousand entries which are randomly loaded with a small simulated delay:
|
1 2 3 4 5 6 7 8 9 10 11 12 13 14 15 |
@RestController @RequestMapping("/persons") public class PersonController { @Autowired private PersonRepository personRepository; @GetMapping public Person getRandomPerson() throws InterruptedException { long randomLong = ThreadLocalRandom.current().nextLong(1, 1000); Thread.sleep(randomLong); return personRepository.findById(randomLong).orElse(new Person("dummy")); } } |
This is of course not a real-world example but the following tips can be applied to any REST based application.
Getting insights with the Java VisualVm
To have a visual overview about what’s going inside the Java application, I’m using Java VisualVM which was is part of the JDK until Java 8 or available for download. If you are using Java 8 and have the JDK installed, you can start the Visual VM with:
|
1 |
$ jvisualvm |
If you have downloaded Java VisualVM manually, you just have to run the executable.
When starting Java VisualVM you can see all running Java applications on your machine and can select one by double-clicking on it in the left-side menu:
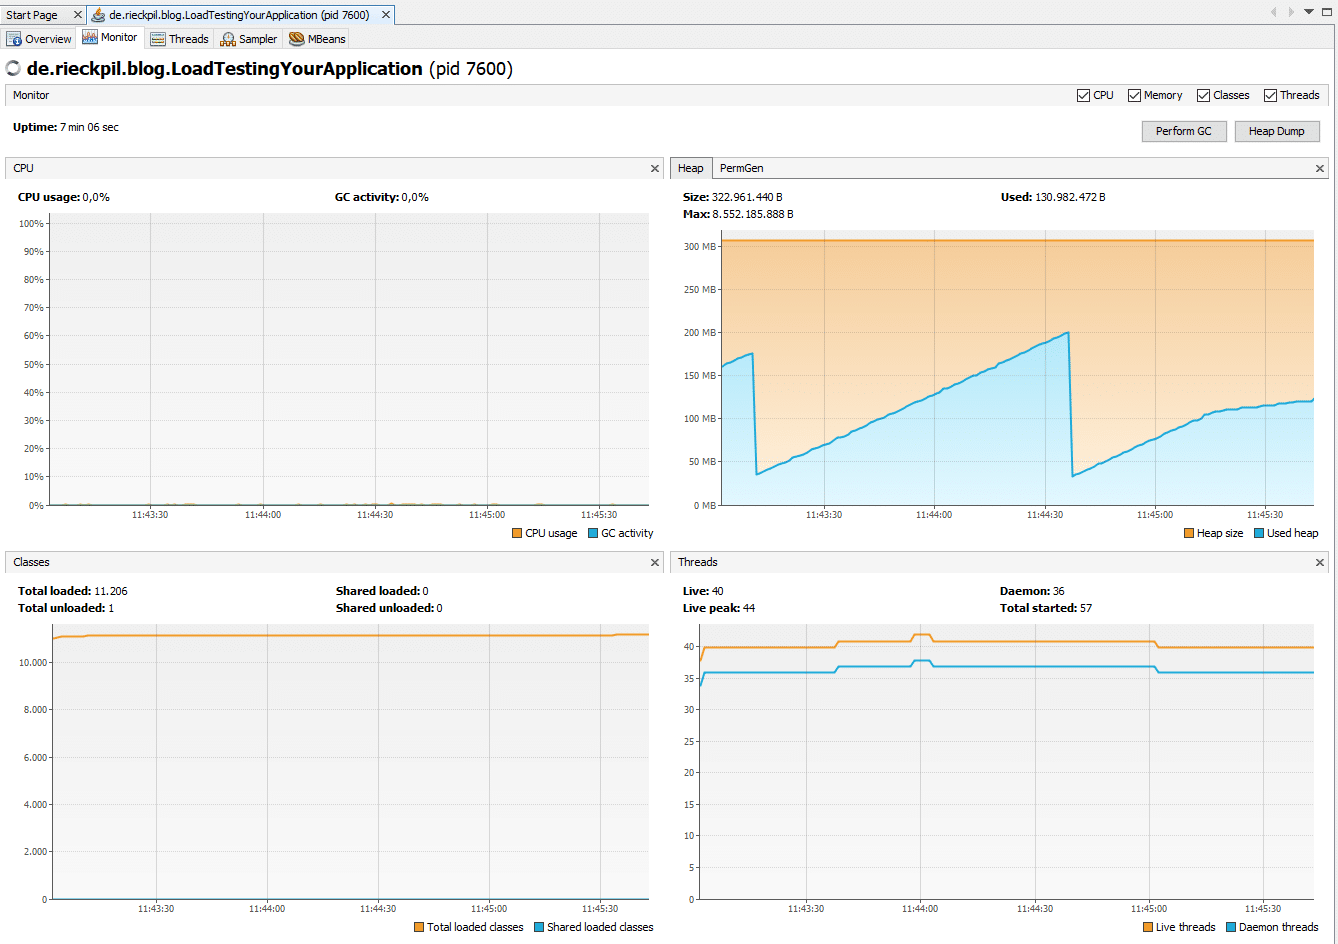
Next, select the tab Monitor to get a visual overview of the CPU usage, heap, amount of loaded classes and threads:
In addition, you can also sample the CPU usage and memory consumption more detailed within the tab Sampler and see which method in your application is taking most of the CPU time:
Perform a load test with Apache Benchmark
To see how your application behaves under load, launch the application and a terminal window. With Apache Benchmark you can specify the number of requests (-n argument) to fire and how concurrently (-c argument – indicating the number of “virtual users”) they are. In our simple example, I’m triggering 5.000 HTTP GET calls with 15 parallel users:
|
1 |
$ ab -n 5000 -c 15 http://localhost:8080/persons |
Apache Benchmark is of course not limited to trigger simple GET-calls, you can simulate any HTTP method, pass HTTP headers, specify the content-type and pass an HTTP body along with the call:
|
1 |
$ ab -p myJson.json -T application/json -H 'Authorization: Token abcd1234' -c 10 -n 2000 http://api.example.com/sample |
After the requests finished, you’ll get a detailed console output with statistics and average execution times about your load-test and during the execution of the HTTP calls your can monitor your application with Java VisualVM in realtime:
|
1 2 3 4 5 6 7 8 9 10 11 12 13 14 15 16 17 18 19 20 21 22 23 24 25 26 27 28 29 30 31 32 33 34 35 36 37 38 39 40 41 |
$ ab -n 5000 -c 15 http://localhost:8080/persons This is ApacheBench, Version 2.3 <$Revision: 1843412 $> Benchmarking localhost (be patient) ... Finished 5000 requests ... Document Path: /persons Document Length: 56 bytes Concurrency Level: 15 Time taken for tests: 168.793 seconds Complete requests: 5000 Failed requests: 485 (Connect: 0, Receive: 0, Length: 485, Exceptions: 0) Total transferred: 874469 bytes HTML transferred: 279469 bytes Requests per second: 29.62 [#/sec] (mean) Time per request: 506.380 [ms] (mean) Time per request: 33.759 [ms] (mean, across all concurrent requests) Transfer rate: 5.06 [Kbytes/sec] received Connection Times (ms) min mean[+/-sd] median max Connect: 0 0 0.4 0 1 Processing: 2 503 291.2 499 1003 Waiting: 2 503 291.2 499 1002 Total: 2 503 291.2 499 1003 Percentage of the requests served within a certain time (ms) 50% 499 66% 668 75% 761 80% 814 90% 905 95% 951 98% 979 99% 991 100% 1003 (longest request) |
This solution can be easily automated during nightly builds e.g. on Jenkins to have a better indicator of how the application behaves under production-load.
You can find the sample Spring Boot project as always on GitHub. For a more sophisticated solution to test internal implementations, take a look at Java Microbenchmark Harness (JMH).
Have fun testing your application under heady-load,
Phil


