From the 14th to the 16th of November I visited the Container Conf 2017 in Mannheim. This conference focussed on the Docker container technology and the ecosystem around Docker. In this blog post, I'll summarize the top five pieces of advice I learned at this conference as a Summary of the Container Conf 2017.
The conference was structured into two parts: conference days and workshop days. On the 14th and the 17th of November, we were able to visit ten different full-day workshops about Kubernetes/Docker/DevOps/Microservices. From the 15th to 16th the conference days took place and about 650 attendees could learn from 60 technical talks about current topics on DevOps and containers.

The beginning keynote was held by Jennifer Davis (@sigje) with the topic: Swimming in Services: Navigating Unknown Waters. Besides that talk there were two more keynotes during the conference: One from the CTO of the N26 bank Patrick Kua and the other one from Brandon Philips the co-founder and CTO of CoreOS.
Let's now focus on the learnings of the Container Conf 2017…
1. Use EFK stack for handling logs in a Kubernetes cluster
As it is quite cumbersome to analyze the log files of every deployed e.g. microservice in a Kubernetes cluster by hand, you should aggregate the logs of your application.
Therefore a speaker presented the EFK (Elasticsearch, Fluentd, and Kibana) stack. As described in the Twelve-Factor App Manifesto your services should always log to stdout. With an additional adapter for e.g. logback you can send your log messages to the logging layer provider Fluentd which will then distribute your logs to several output systems. With Fluentd you can define routes that e.g. your Apache Web server logs and the logs of your Spring Boot microservices are both distributed to Elasticsearch/AWS S3/MongoDB. A Fluentd config for the distribution of Spring Boot logs to Elasticsearch could look like the following:
|
1 2 3 4 5 6 7 8 9 10 11 12 13 14 15 16 17 18 19 20 21 22 23 |
<source> @type forward port 24224 </source> <match *.**> @type copy <store> @type elasticsearch host localhost port 9200 logstash_format true logstash_prefix fluentd logstash_dateformat %Y%m%d include_tag_key true type_name access_log tag_key @log_name flush_interval 1s </store> <store> @type stdout </store> </match> |
In your microservices you can define the Fluentd appender quite easy in your logback.xml:
|
1 2 3 4 5 6 7 8 9 10 11 12 13 14 15 16 17 18 19 20 21 |
<?xml version="1.0" encoding="UTF-8"?> <configuration> <include resource="org/springframework/boot/logging/logback/base.xml" /> <property name="FLUENTD_HOST" value="127.0.0.1" /> <property name="FLUENTD_PORT" value="24224" /> <appender name="FLUENT" class="ch.qos.logback.more.appenders.DataFluentAppender"> <tag>fluentd</tag> <label>test</label> <remoteHost>${FLUENTD_HOST}</remoteHost> <port>${FLUENTD_PORT}</port> <maxQueueSize>20</maxQueueSize> </appender> <logger name="de.rieckpil" level="info" additivity="false"> <appender-ref ref="CONSOLE" /> <appender-ref ref="FILE" /> <appender-ref ref="FLUENT" /> </logger> </configuration> |
With Kibana you can now visualize the logs, build dashboards for your logs and search for bugs in a centralized system without manual work.
2. Gradle as Java build tool
We all know Maven as a build tool for Java and some of you might have seen a Gradle option when you try to import a new library for your Java project. As Maven is always displayed as the first option for dependency management I realized that there are other build tools like Gradle but I never looked at these build tools.
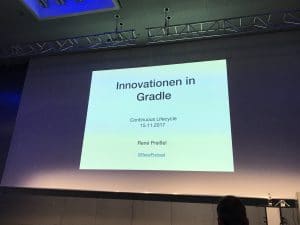
Different speakers at the conference recommended Gradle and one talk was dedicated to the latest innovations in Gradle.

With Gradle, you won't write any pom.xml but now build.gradle and settings.gradle files. These files are structured straightforward and written in either Groovy or Kotlin.
An example build.gradle file for a small Spring Boot app could look like the following:
|
1 2 3 4 5 6 7 8 9 10 11 12 13 14 15 16 17 18 19 20 21 22 23 |
buildscript { ext { springBootVersion = '1.5.8.RELEASE' } repositories { mavenCentral() } dependencies { classpath("org.springframework.boot:spring-boot-gradle-plugin:${springBootVersion}") } } apply plugin: 'java' apply plugin: 'org.springframework.boot' repositories { mavenCentral() } dependencies { compile("org.springframework.boot:spring-boot-starter-web") testCompile("junit:junit") } |
The most convincing fact about Gradle for me was that Maven had eight releases since 2005 and Gradle released a new version 35 times since 2012. Furthermore, the speakers mentioned the following pros of using Gradle:
- incremental builds
- reduced build script complexity
- integrated build cache (only local changes that don't build yet, are compiled)
- Google uses it for it's Android development
For the next projects, I will use Gradle instead of Maven and inform you about my experience in the near future.
Furthermore, the speaker mentioned that Java developers should definitely have a look at the programming language Kotlin.
3. Serverless computing
With serverless computing, you just write plain functions that are triggered by an API-Gateway or an event. Therefore you just have to pay for each function call and won't have pay for the idle time.
The speaker used AWS Lambda as a cloud service from Amazon for deploying a lambda function. He played around a bit with these functions and presented his experiences.
For one of his Java examples, he mentioned that for a “cold-start” of a lambda function a containerized JVM is launched which will cost time and this JVM should be held “alive” with to avoid this problem for further lambda calls.
A possible use case for these lambda functions could be an image processing function that will create a thumbnail out of an uploaded user image and store it e.g. to an S3 bucket. Eberhard Wolff, for example, uses lambda functions for an automatic response for one of his mail accounts to send the conference slides directly to a requesting attendee.
For a more complex application like microservice system architecture, it is quite difficult to debug the serverless application and test it.
4. Adding security checks to your build pipeline
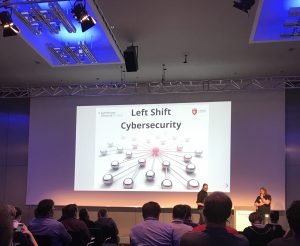
In the interesting talk with the topic Left Shift Cybersecurity the two speakers explained their experience with security issues of their Java applications. They work for a security company and among other things they have pen-testers that manually check the security and robustness of their client's application. As there are always the same basic security issues with web applications like XSS and SQL injections they wanted to statically find these “low hanging fruits” in a build pipeline to enable their pen-testers to concentrate on more complex issues.

They presented both commercial and open-source Java libraries for this task. For a dependency vulnerability check, they showed an example with the DependencyCheck. While using open-source tools for this task they called attention to analyze the generated reports with caution. The security databases might not always be up-to-date and some tools mix up some dependencies. A Commercial library is for example Snyk.
Another check was the static code analysis check with the tool FindBugs which can be integrated into the build pipeline and generate reports (other tools they mentioned: Veracode and Checkmarkx). Here again, it is important to not blindly trust the results of this check because there are also some code elements which will be reported as “bugs” but are wanted. He used an example with the @RequestMapping() annotation in Spring Boot which publishes an endpoint and was marked as “insecure”. Strangely enough, @GetMapping() was not reported as a “bug”.
For more dynamic security checks they showed an example with ZAP Proxy. With this tool, they were able to detect an XSS and a SQL injection issue during their build.
To sum the talk up they recommended to use this kind of static security check but do not depend on the success of your build on these checks as you should always analyze the generated reports twice.
5. Prometheus and Grafana
Besides the EFK stack for aggregating application logs in a Kubernetes cluster, you also want to have live monitoring of your system/application/host metrics.
For this task, the open-source solution Prometheus in addition to Grafana are currently de facto standards for collecting and visualizing metrics. Both Prometheus and Grafana can be integrated into the Kubernetes cluster.
The most common host metrics (e.g. CPU, disk, RAM, network…) are gathered with the node-exporter from Prometheus. In addition, you can collect metrics about the container resource metrics with the cAdvisor. With the simpleclient as a Java dependency your application is able to publish internal Java metrics for Prometheus (e.g. time calculation, call hierarchies …). Spring got an own library called simpleclient_spring_web to use an AOP collector which is able for example to measure the duration of a method with the @PrometheusTimeMethod() annotation. Moreover, there are some extensions for tracking database' metrics to monitor for example the elapsed time of a REST request in every part of your backend.
I hope you liked the Summary of the Container Conf 2017!
docker stop summarizing-conference-service

